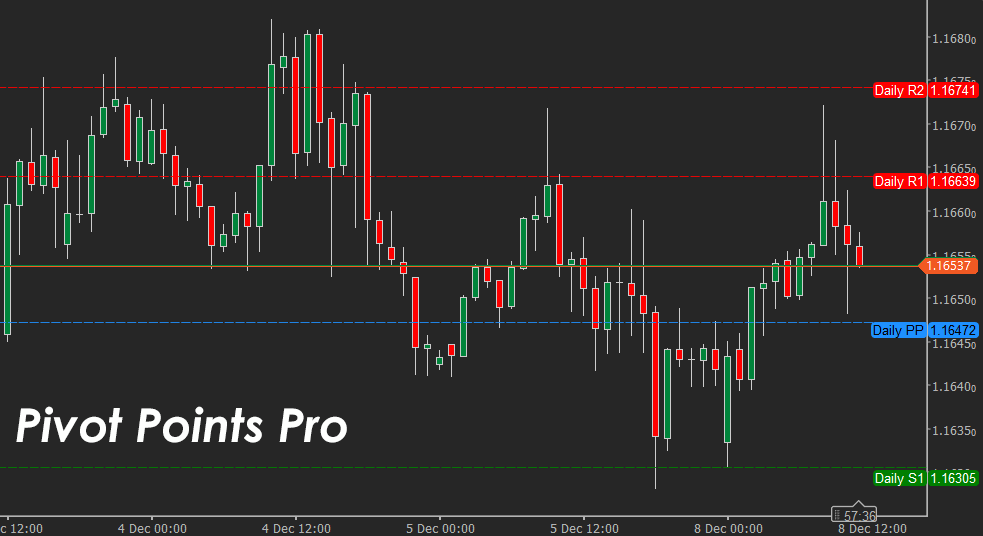
The updated cTrader Pivot Point Indicator is now available, offering a more flexible, structured way to identify key market levels. Pivot Points remain one of the most widely used tools for mapping intraday structure, spotting reversal zones and defining profit targets. This version includes four calculation methods—Classical, Fibonacci, Camarilla, and Woody, so traders can choose the approach that best fits their strategy.
The indicator supports multiple time frame options, including 1-hour, 4-hour, 8-hour, 12-hour, daily, weekly, and monthly pivots. It also allows up to four support and resistance levels, fully customisable line styling and adjustable price label visibility.
Key Features
- Four pivot-point calculation methods.
- Configurable pivot periods from intraday to monthly.
- Up to four support and resistance levels.
- Adjustable colours, label display modes and line thickness/types.
Calculation Methods Overview
Classical
The most widely used method is based on the average of the previous session's high, low and close.
P = (H + L + C) / 3
Fibonacci
Applies Fibonacci ratios to the previous period’s range, creating levels that often align more closely with natural retracements and extensions.
Camarilla
Introduced by Nick Scott in 1989, this method produces eight levels using fixed multipliers. It is popular for intraday mean-reversion and reversal strategies.
Woody
Places additional emphasis on the previous close and the range difference, making it more responsive during strong trending conditions.
Download here: https://clickalgo.com/pivot-point